NZ Economic Drivers Pre-COVID
Page updated: 5 January 2021
The key question explored here is not just what drives the New Zealand economy over the medium to longer term, but rather how we can expect changes to impact on the SAR sector and its operations.
To answer this question, it is worth reflecting on the economic drivers in place before COVID-19 struck.
NZ's Economic Growth pre-COVID
Before COVID-19, New Zealand was in a strong position economically with reasonably strong and long-term economic growth.
In 2017, before COVID-19 hit, we noted that annual real GDP growth was projected to rise to a peak of 3.8% before slowing to 2.4% by 2021.
The expected spike in GDP never happened and instead it gradually slowed to its pre-COVID rate of 2.4%.
This said, New Zealand was in a strong economic position overall prior to COVID-19, with the government projecting a $3.9 billion surplus in the year to June 2019.[1]
---
[1] NZ Herald (20 May 2019). ‘Budget 2019: NZ surpluses narrow as spending ramps up’, https://www.nzherald.co.nz/business/budget-2019-nz-surpluses-narrow-as-spending-ramps-up/MSWIX7MH5IU3TAAETKNWILP5ZU/, Accessed 6 Jan 2021.
Employment Pre-COVID
According to the OECD, New Zealand’s employment rate remained high relative to most OECD countries, rising from 75% of the working age population to 77% by 2019. (OECD 2019)
Alongside this, the unemployment rate dropped to 4.2%, slightly below the 4.25% that was projected at the time of the 2017 environmental scan (Statistics NZ 2019).
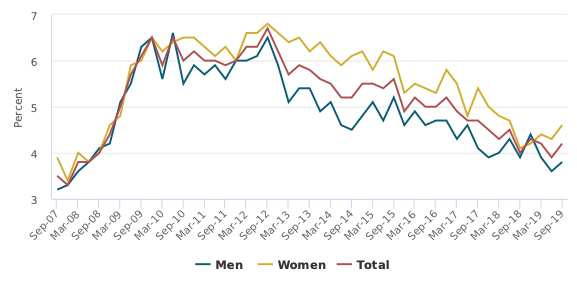
Unemployment rate by sex, seasonally adjusted, Sep 2007 – 2019 quarters (Statistics NZ)
Tourism was big business pre-COVID
Before COVID-19 hit, tourism was big business in New Zealand and across the whole search and rescue region.
Tourism contributed strongly to the New Zealand economy until 2020.
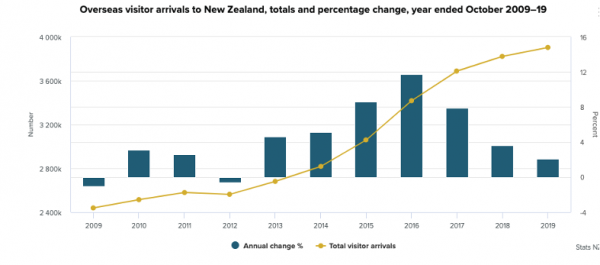
The number of international visitors increased 1.3 percent (47,939) in the year ended March 2019, following an increase of 7.8 percent in the previous year (Statistics NZ 2019).
3.9 million tourists arrived in the year to ended September 2019, up 95,319 from the year ended September 2018, with visitors from Australia hitting a record high of 1.5 million (Trading Economics 2019).
Tourism expenditure contributed $12.9 billion to the New Zealand economy in 2016. By March 2019 this had reached $16.2 billion (Statistics NZ 2019).
The following graph gives an indication of the main source of visitors to New Zealand.
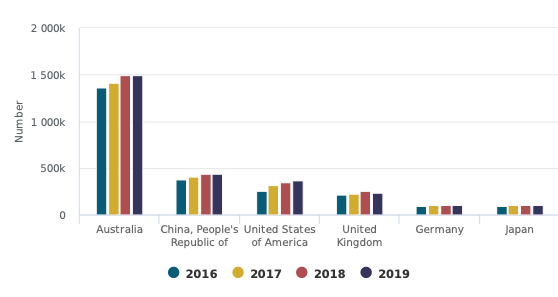
Overseas visitor arrivals by selected country of residence, year end March 2016-2019 (Statistics NZ)
While the total number of visitors to New Zealand continued to increase over the 3 years to 2019, as illustrated in the graph below, the growth rate had already begun to taper off This was driven by a drop in visitors from Asia, and particularly from China.
Many tourists were drawn by the prospect of outdoor recreation...with its risks
Walking and hiking have been popular draw cards for international visitors for a long time.
For example, 73% of holiday visitors participated in walking or hiking in the last 3 years – an average of 1.1 million people per year. (Tourism NZ 2019) Another 1.53 million adults took part in recreational boating over the 2018-2019 summer (Maritime New Zealand 2019).
The way international visitors participate in the outdoors tends to be quite different from that of New Zealanders. Most international visitors (75%) participate in short walks of 3 hours or less. Only 3% of them participate in an overnight trek or tramp (Tourism NZ 2019). By contrast, many more New Zealanders participate in overnight tramping.
The graph below shows this difference in outdoor recreation preferences clearly, which unfortunately flows through to outdoor fatality statistics too. Many more New Zealanders are killed during overnight tramps, in contrast to international visitors, for whom the split between fatalities on short walks and overnight tramps is much more even.
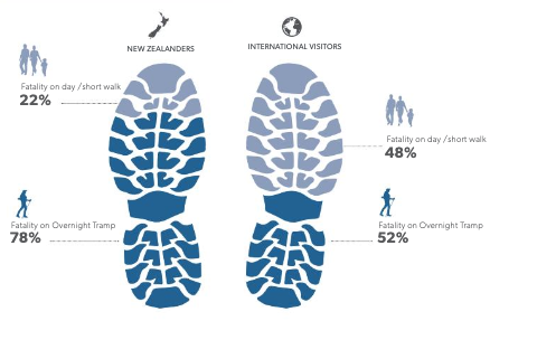
Outdoor deaths, visitors versus New Zealanders (Mountain Safety Council, 2018)
This may suggest that kiwis are often over-confident when it comes more ambitious tramping expeditions, whereas international visitors are perhaps simply less well-prepared for short walks (Mountain Safety Council 2018).
The Maritime Economy was thriving pre-COVID
Prior to COVID-19, the Maritime Economy was thriving. The 'maritime economy' includes the global merchandise shipping trade, the cruise sector and the fishing industry.
Prior to COVID-19, the global shipping trade was accelerating
The increase in global merchandise trade pre-COVID is clearly demonstrated by the diagram from the Organisation for Economic Cooperation and Development (OECD) below.
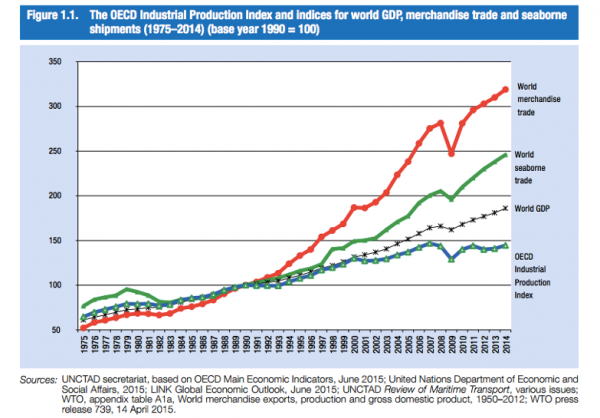
UNCTAD Review of Maritime Transport
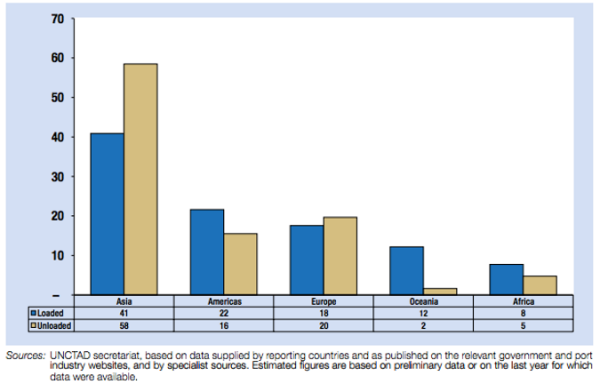
The Asia-Pacific region dominated the growth in world seaborne trade until the event of COVID-19, as highlighted in the diagram below.
UNCTAD Review of Maritime Transport[i]
The cruise sector was also taking off...with impacts for SAR
The cruise sector was also growing rapidly, economically benefitting both New Zealand and the other countries across the NZSRR. During the 2016-17 season there were 235,900 passengers that undertook a cruise in New Zealand. The total value added (synonymous with GDP) to the economy by cruise tourism for the 2016-17 season, was $447 million, which was expected to increase to $640 million by 2018-19.
Cruise ships are generally a very safe way to travel. However, they do sometimes suffer from problems, most of which are very low level. For example, globally:
● between 1990 and 2011, there were around 79 fires on cruise ships;
● From 1980 to 2012, about 16 cruise ships have sunk
● there are around 3-4 preparations to evacuate ship, though actual evacuations are very rare; and
● around 2 ships a year run aground.[ii]
According to a report from research firm G.P. Wild, globally each year an average of 10 people die and 60 more were injured on a cruise as a result of so-called “operational incidents,” which are basically mishaps — things like fires and explosions, collisions, technical failures and ships getting stranded, grounded or sinking — that cause delays, injuries or fatalities[iii].
The bottom line is that things will occasionally go wrong on cruise ships (e.g. power failures or insufficient fuel), but lives are very rarely put at risk.
More shipping trade and more cruises meant crowded seas
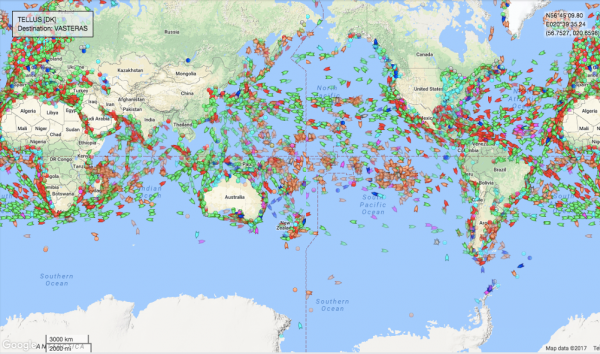
The map below gives some idea of just how crowded the seas were becoming as a result of much more seaborne trade, fishing and more passenger vessels, prior to 2020.
Marinetraffic.com
Overall contribution of the maritime economy pre-COVID (and impact on SAR demand)
In the year ended March 2017, the marine economy contributed $3.8 billion to New Zealand’s economy. Over the same period, shipping contributed around $1.4 billion (Statistics NZ 2019). Fishing revenue is also estimated to have contributed around 2% of New Zealand’s annual GDP, or approximately 1.8 billion in the year to October 2019.
In short, the marine economy was big business prior to COVID-19. In the year ended June 2019, there were 322,000 cruise ship passengers, up 24 percent from 2018 (Statistics NZ 2019). More than two thirds of this increase came from Australian passenger numbers and three quarters of them were aged 50 or over. Over this time, cruise ship expenditure in New Zealand totalled $569.8 million, an increase of 28.2 percent since the previous year (Statistics NZ 2019).
The continued increase in sea-based trade, fishing and recreation (e.g. more people on cruise ships) did not necessarily translate to more people needing search and rescue. However, it did suggest that, prior to COVID-19, the task of keeping people safe in more congested seas would become increasingly complex over time. Of course, such risks have since waned due the reduction in maritime trade, cruises and the fishing industry since COVID-19.
---
[i]United Nations Conference on Trade and Development (2015). “Review of Maritime Transport 2015”, United Nations.
[ii] "Cruise Mishaps: How Normal Are They? - The New York Times." 8 May. 2013, http://www.nytimes.com/2013/05/12/travel/cruise-mishaps-how-normal-are-they.html. Accessed 4 Oct. 2017.
[iii] "Here are the odds your cruise vacation goes horribly ... - MarketWatch." 24 Jan. 2015, http://www.marketwatch.com/story/how-deadly-and-sickening-cruises-are-in-3-charts-2015-01-21. Accessed 4 Oct. 2017.
The Air industry was expanding too
As well as significant growth in volume in our seas, we were expecting ongoing increase in air traffic to New Zealand before COVID-19 hit.
The graph below illustrates that the Asia-Pacific region was expecting one of the high growth rate in air traffic in the world over the next 25 years.
This projection reflected both growth in passenger traffic and cargo movement around the world.
Passenger traffic was forecast to double to over 14 billion by 2029 as highlighted in the graph below.
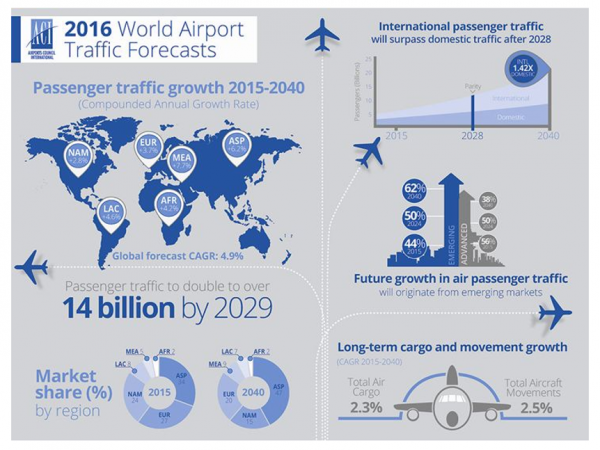
Source: WeForum
Antarctica was an increasingly popular destination
Before COVID-19, Antarctica was growing in popularity as a destination for adventurers and scientists.
Tourist expeditions have ventured to Antarctica every year since 1966. In recent years, these expeditions largely were conducted aboard some 40 vessels, each carrying from six to 500 passengers. The ships sailed primarily to the Antarctic Peninsula region[i].
Tourism to Antarctica was steadily on the rise and was nearly at its highest levels again by 2019, as set out in the diagram below.
In the 2016-17 season, there were 44,202 visitors.
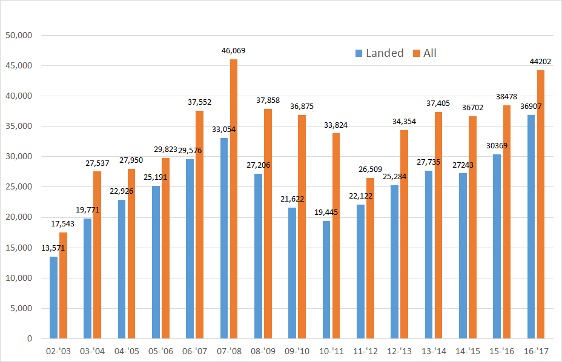
Tourist numbers to Antarctica, landed and all, 2002 - 2017 (Source: P. Ward, "Cool Antarctica")
Both large and smaller groups going to Antarctica present risks in terms of potential demand for search and rescue. Even when in larger boats and planes, visitors may face dangers due to mechanical failure, running out of fuel, storms or ice.
As more and more cruise ships and aircraft visited Antarctica, we would likely have seen increased numbers of older people having medical misadventures there also.
Another threat came from smaller expeditions that are becoming increasingly common by individuals and small parties. This is demonstrated by the graph below:
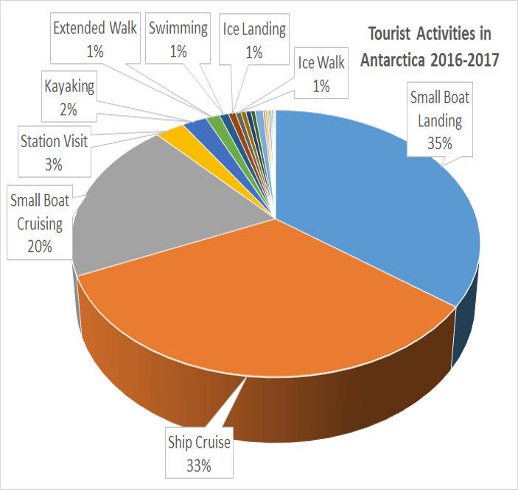
Tourist Activities in Antarctica, Source: Ward P. Cool Antarctica
As one commentator put it:
Antarctica requires careful planning and a series of fail-safe rescue procedures if anyone gets into difficulty. These smaller expeditions sometimes fail to do this adequately and resort to "humanitarian" requests for aid from shipping or nearby national bases when they get into difficulty.
A few years ago, for example, a small helicopter (totally unsuitable for the task) crashed into the sea off the Antarctic Peninsula[ii] requiring rescue and an attempt to fly across Antarctica via the pole in a small aircraft ended with the aircraft crashing and the pilot being rescued by nearby base personnel.”[iii]
The weather in the Southern Ocean is nature at its most extreme, with the potential for hurricane force winds and waves as high as 18-23 meters. With modern safety and ship design the odds of sinking are low, but the odds of being thrown about by a wave are high.[iv]
Generally, numbers of SAR incidents in Antarctica are rare , but when they do occur they are highly costly and tricky to coordinate.
This is because they rely on coordination across the multiple nations to negotiate issues around territorial sovereignty, occasional international tensions and accessing the closest and best assets to effect a timely search and rescue operation.
Even more difficult is that such search and rescue operations must operate under critical timeframes with little room for error, and lives at stake in very remote areas
---
[i] "Tourism Overview - IAATO." https://iaato.org/tourism-overview. Accessed 4 Oct. 2017.
[ii] Morris, S (28 January 2003). ‘Explorers or boys messing about? Either way, taxpayer gets rescue bill’, The Guardian, https://www.theguardian.com/uk/2003/jan/28/stevenmorris
[iii] Ward, Paul (2001). “Cool Antarctica”, https://www.coolantarctica.com/Antarctica%20fact%20file/science/threats_tourism.php
[iv] "Antarctica - Wikitravel." http://wikitravel.org/en/Antarctica. Accessed 4 Oct. 2017.
Economic growth and volunteering don't always go hand-in-hand
While economic growth and low unemployment are generally considered good things, there is some evidence to suggest that full time employment may displace some other civically-beneficial activity, such as volunteering.
Furthermore, higher employment rates do not necessarily translate to higher wages and disposable income. This means that higher employment may also not empower people to enjoy more leisure (or to have more time for things like volunteering).
Our 2017 environmental scan observed that, adjusting for inflation, real wages had shown a downward trajectory for the previous 5 years. This concern has driven a desire by some governments (including New Zealand’s) to start seeing economic and social improvement in a more balanced way. This is partly why there has been a recent move in New Zealand and other countries to prioritise ‘gross national wellbeing’ rather than just ‘gross domestic product’ (Samuel 2019).
So, did the reduction in average real wages continue between 2017 and 2019 (before COVID struck)? In short, no. Real wages are endogenous; that is, able to be affected by changes in government policy. For example, on 1 April 2018, the Government raised the minimum wage by 75 cents, to $16.50 an hour and it will continue to rise in increments to $20 an hour by 2021 (at time of writing it has already risen again to $17.70).
Analysis by Statistics NZ has found that this very first increase pushed wages and salaries up “with some of the biggest increases coming from some of the lowest paid industries”. For example, average hourly earnings for accommodation and food services, and retail trade increased 2.1 and 1.6 percent respectively, for the June 2019 quarter (Statistics NZ 2018).
In the graph below, you can see that, since July 2017, before COVID-19 hit, unemployment was tracking downward, but average real wages had started growing again. This was good insofar as increased real wages mean the average New Zealander has more money to pay for things like participating in outdoor recreation and more opportunity to do so by choosing more leisure over work while still having enough money to pay for everyday costs.
In short, if people have a good job and plenty of income, they are both more likely to spend money on recreation (often outdoors) and to volunteer, both of which impact on the SAR sector, but in different ways.
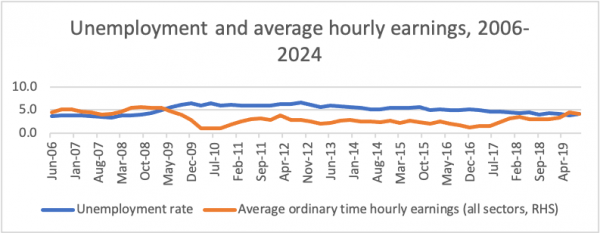
(The Treasury 2019)
Making inroads into inequality
Was New Zealand becoming more or less equal over time before COVID-19, and what impact might the level of inequality have on the search and rescue sector?
As measured by the gini coefficient (where a higher coefficient means more inequality), prior to COVID-19, New Zealand already had a consistently higher level of income inequality than the OECD average between 1990 and 2014, as illustrated below.
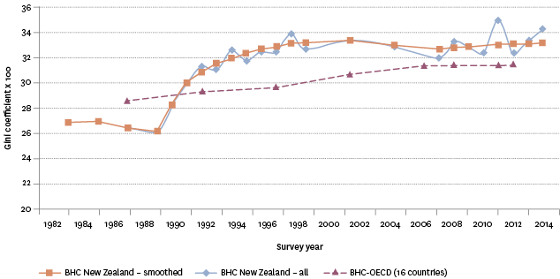
(Bryan Perry 2015)
Inequality is not just a question of income – it is also a question of accumulated wealth over time.
For much for the late 1990s and early the early 2000s, the distribution of wealth among households in New Zealand was similarly skewed heavily in favour of those at the top of the income spectrum. Even as late as 2015, the wealthiest 20 per cent of households in New Zealand held 70 per cent of the wealth, while the top 10 per cent held half the wealth.[i]
The chart above highlights that, while economic growth is generally considered a good thing, not everybody automatically benefits from it.
One reason that inequality is relevant for the search and rescue sector is that it may indirectly create challenges for securing a sufficient number and diversity of volunteers. If people spend more time working to get enough income to live, they tend to have less time available for volunteering. This is particularly the case for people from economically-disadvantaged households, such as many Māori and Pacific families, who disproportionately find themselves working multiple jobs.
Research by Sport NZ has demonstrated that people from low socio-economic backgrounds are less likely to participate in sport and recreation in outdoor settings[ii].
In short, economic inequality in New Zealand could reduce the ability of poorer people to enjoy the outdoors.
In theory, a possible benefit of some people having less time to participate in the outdoors could be a small potential reduction in demand for SAR services. However, in reality, only a very small proportion of people who participate in the outdoors every use a SAR service, so any reduction in demand is likely to be negligible in reality.
So, what affects how equal or unequal a country is?
Household income levels and rates of taxation and transfers (more often called ‘benefits’) to poorer families have a particularly strong impacts. For example, between the late 1980s and early 1990s, poverty rates (measured in multiple different ways) more than doubled “due to rising unemployment, falling average real wages, benefit cuts and the introduction of market rents in social housing (Ministry of Social Development 2019).
Over the last three decades, housing costs also have continued to take a much larger proportion of household income, especially for low-income households. This is demonstrated by the size of the population in low-income households being significantly higher once housing costs are taken into account (ACH = ‘After Housing Costs’ low income household line, whereas BHC means ‘Before Housing Costs’).
While challenges remain in addressing high housing costs for many New Zealanders, successive governments’ efforts to reduce inequality appear to be starting to work. For example, poverty steadily fell through to 2007 with improving employment, a rising average wage, rising female employment, the introduction of income-related rents and the Working for Families package (Ministry of Social Development 2019).
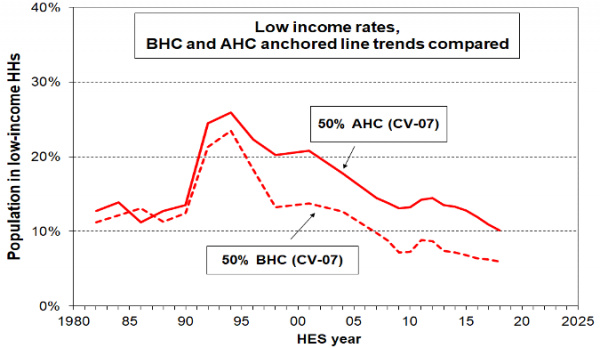
This said, there remain indications that there are some persistent and lingering effects from the poverty and inequality that characterised New Zealand between the late 1980s and early 2000s. For example, a survey of 900 people by the Council of Trade Unions in 2019 found that “56 percent struggled to pay for basic necessities like rent, power and petrol” (Radio New Zealand 2020).
|
"Low wages and high rents are a bad mix, and that's what a lot of working people are caught in the middle of." – Council of Trade Unions (Radio New Zealand 2020) |
Those at the bottom of the income distribution typically spend a higher proportion of their incomes. This means that any reduction in inequality is likely to have a disproportionately positive impact on their ability to participate in the outdoors, and to volunteer.
In summary, reducing inequality is good news for more volunteering. It is also good news in terms of enabling people from more ethnically diverse backgrounds to volunteer, since a greater proportion of non-NZ Europeans suffer economic deprivation.
---
[i] Fyers, Andy. “The Truth about Inequality in New Zealand.” Stuff, www.stuff.co.nz/business/88455171/the-truth-about-inequality-in-new-zealand.
[ii] "Sport and Active Recreation in the lives of New Zealand Adults." http://www.sportnz.org.nz/assets/Uploads/attachments/managing-sport/research/Sport-and-Active-Recreation-in-the-lives-of-New-Zealand-Adults.pdf. Accessed 4 Oct. 2017.
Automation of work
In the longer term, one of the implications of rapid advances in AI and robotics is that more and more work will be able to be automated. As we have explored in the section on technology, this could have profound implications for how searches and rescues are done.
AI is particularly helpful in replacing human labour for jobs that involve repetition or following a list of instructions (otherwise known as an algorithm). Many jobs currently done by humans involve exactly this kind of work. Consequently, people all around the world have predicted many jobs being automated in the near future.
In Britain, commentators are predicting that more than 10 million workers are at high risk of being replaced by robots within 15 years.[i] In the USA, estimates are as high as 60 per cent.[ii] In New Zealand, NZIER has estimated up to 46% of jobs are at high risk from automation over the next 20 years.[iii]
However, some commentators are beginning to suggest that the future may not hold mass unemployment as much as mass adjustment and evolving employment. In particular, these analyses suggest that the direction, at least in the short term, will be towards humans working alongside automated and robotic systems to get the best of both worlds[iv].
With increased automation, it is possible people will have more time for leisure. However, this has not been the case to date. In 2013, 61.5% of people worked 40 hours or more per week in their main job; this was an increase from 59.2% in 2006.
In the long term, particularly with the event of quantum computers, it is possible that humans will be less needed. In this scenario, unless we retrain a large number of people in non-automatable work reasonably rapidly, we can expect that large numbers of people will have less work due to automation.
Less employment for some is likely to lead to less income for them to participate in certain leisure activities – e.g. those requiring money such as boating, flying or using jet skis.
However, in the context of COVID-19, which is spread mainly by human-to-human contact, automating certain tasks still benefits the economy while reducing the potential for virus spread.

